In our worked example, half a percentage point better conversion adds 5,400 USD a month without a single extra visitor.
A/B testing needs tens of thousands of visits before you can trust the result. With less traffic, you get more from checking your tracking, watching recordings of real sessions and removing the biggest obstacle in your form or checkout.
What You'll Learn in This Post
- What conversion rate optimization is, and how to calculate your conversion rate
- What half a percentage point better conversion is worth in dollars
- How much traffic A/B testing needs, and why it rarely suits small websites
- A six-step method that works even with little traffic
- Why customers abandon a purchase, and what to do about checkout and forms
- How cookie consent rules affect your numbers
What Is Conversion Rate Optimization?
Conversion rate optimization is the work of getting a larger share of your visitors to do what you want them to do. It is often shortened to CRO. The goal can be a purchase, a phone call, a booked site visit or a completed contact form.
So a conversion is not only a sale. For a plumber, it is a tap on the phone number. For an online store, it is a completed order, and for a B2B company, it can be a downloaded price list.
The difference from SEO and advertising is the direction. SEO and Google Ads bring in more visitors. Conversion rate optimization gets more out of the visits you have already paid or worked for.
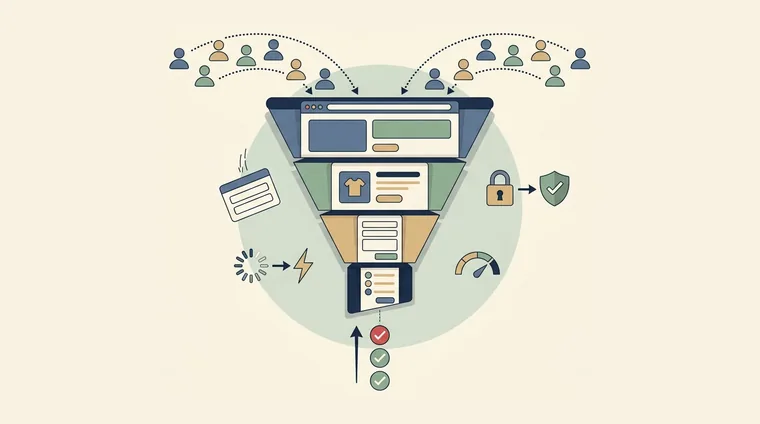
How to Calculate Your Conversion Rate
The conversion rate is the number of conversions divided by the number of visits, multiplied by 100. If the website has 4,000 sessions a month and 60 inquiries, the conversion rate is 1.5 percent.
Conversion rate = conversions ÷ sessions × 100
Use sessions as the base and stick to the same definition over time. In GA4, conversions are now called key events, and you find the rate per channel in the acquisition reports. The point is that the number can be compared from month to month, not that it is perfect.
Also separate main goals from micro goals. The main goal is the purchase or the request. Micro goals are steps along the way, such as adding an item to the cart or opening the contact page, and they show where in the process people drop off.
What Is a Good Conversion Rate?
There is no single right number. Unbounce analyzed 41,000 landing pages with 464 million visits in the fourth quarter of 2024, and the conversion rate was around 6.6 percent across industries. Landing pages with one clear goal do better than regular websites where people arrive from many directions.
An online store is usually far lower. Baymard Institute has collected 50 studies and estimates that 70.22 percent of all shopping carts are abandoned before the purchase is completed.
The best benchmark is your own history. Compare the same channel, the same device and the same season. A jump from 1.5 to 2 percent on mobile tells you more than beating an industry average from completely different websites.
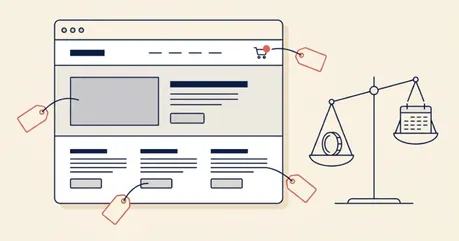
What Is Half a Percentage Point Worth to You?
Many skip conversion rate optimization because the increase sounds small. Count in dollars instead. The example below is a service business with 3,000 visits a month, where 30 percent of inquiries turn into jobs worth 1,200 USD.
| Before | After | |
|---|---|---|
| Visits per month | 3,000 | 3,000 |
| Conversion rate | 1.5 percent | 2.0 percent |
| Inquiries | 45 | 60 |
| Jobs (30 percent) | 13.5 | 18 |
| Revenue per month | 16,200 USD | 21,600 USD |
Half a percentage point gives 5,400 USD more a month, without a single extra visitor. To get the same 15 inquiries from ads, you would need around 1,000 more clicks. At a cost per click of 2 USD, that is about 2,000 USD extra in ad budget every month. See what Google Ads costs for click prices in different industries.
The math also works the other way. If you raise the ad budget for a page that converts poorly, you pay for clicks that give you nothing. So check the conversion rate before you raise the budget.
Why A/B Testing Does Not Fit Most Small Businesses
In an A/B test, half of the visitors see one version of the page, while the rest see another. The method is good, but it needs a lot of traffic before you can trust the answer. With too few visits, you read random swings as real effects.
The table shows how many visits you need in total to detect an improvement with common statistical requirements, which means 95 percent significance and 80 percent power. We calculated the numbers with the same method as the widely used calculator by Evan Miller.
| Conversion rate today | Visits to detect a 20 percent improvement | Visits to detect a 50 percent improvement |
|---|---|---|
| 1 percent | 85,400 | 15,500 |
| 2 percent | 42,200 | 7,700 |
| 3 percent | 27,800 | 5,000 |
| 5 percent | 16,300 | 2,900 |
Take the service business from the example above, with 3,000 visits a month and 1.5 percent conversion. To detect a 30 percent improvement, it needs around 26,000 visits. The test would then have to run for almost nine months, and seasons, campaigns and changes in Google would disturb the result along the way.
So testing is not useless. But small and midsize websites get more out of fixing clear problems than out of testing button colors. Online stores with thousands of orders a month, on the other hand, should test regularly.
How to Do Conversion Rate Optimization With Low Traffic
The method below needs no testing tools. It builds on one idea: the biggest obstacles are usually visible if you know where to look.
1. Check That the Tracking Is Right
Before you change anything, you need to know the numbers are correct. Send the form, complete a purchase and tap the phone number yourself, and check that each action shows up in GA4 and in your ad account.
Tracking errors are more common than many think. The online store VuggeBaby had a period where a silent change at a third party broke all purchase tracking, without anything visibly failing. Errors like that make you change things that work.
2. Find Where People Drop Off
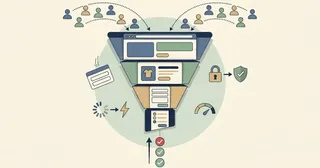
Set up the funnel from the first page to the completed action, and see where the share falls sharply. In an online store, it often happens between the cart and the checkout. For a service business, it is often between the service page and the contact form, or in the middle of the form itself.
Also split the numbers by device. Many websites convert far worse on mobile than on desktop, because forms and menus were made for a large screen.
3. Watch How Real Visitors Use the Page
Session recordings and heatmaps show what the numbers do not tell you. Microsoft Clarity is free and shows where people click, how far they scroll and where they click again and again because something does not work.
Watch 20 to 30 recordings of sessions that did not end in a conversion. You will often see the same problem over and over, such as a button that does not look clickable or a field that rejects the answer without explaining why.
4. Ask Your Customers
The fastest insight often comes from asking. Call three customers who bought recently, and ask what almost made them decide not to. Also read through emails and chats from the last few months, and note the questions that keep coming back.
Questions that keep coming back are answers missing from the website. If many ask about price, delivery time or service area, the answer should be where the decision is made. An AI chatbot also gives you a log of what visitors want to know before they buy. The article on AI agents vs. chatbots explains the difference.
5. Fix the Biggest Obstacles First
Rank your findings by how many people they affect and how easy they are to fix. A confusing checkout field that everyone meets comes before new homepage copy that few read. Make one group of changes at a time, so you know what had an effect.
6. Measure Before and After Over at Least Four Weeks
Without enough traffic for A/B testing, you compare periods. Note the date of the change, and compare four weeks before with four weeks after. If you have numbers from the same period the year before, include them to see the season.
The answer is not as certain as in a test. But it is far better than guessing, and it quickly shows you if a change made things worse.
Changes That Often Increase Conversions
Every website is different, but some problems show up on almost every website we look at. The list below is a good place to start.
Make the Page Faster
Speed affects both how many people stay and how many buy. Google commissioned a study from Deloitte and the agency 55, which measured 37 brands and 30 million sessions in 2019. A 0.1 second improvement in mobile speed gave 8.4 percent more conversions in retail.
On lead generation sites, the share of visitors who moved on to the form rose by 21.6 percent. Start with image sizes, hosting and unneeded plugins. The checklist in the article on technical SEO covers the most important parts.
Cut Form Fields
Every field is a reason to give up. Expedia had an optional company name field in its booking form that confused customers and led to failed payments. The company said in 2010 that removing the field added 12 million USD in annual profit.
Only ask for what you need to answer the customer. Name, phone or email and a short description is enough for most service businesses. The rest you can cover in the conversation.
Show the Price or the Price Level
If the price is missing, customers have to get in touch just to find out if you are an option. Many move on to a competitor that shows a number instead. A price range or a starting price is often enough for the customer to get in touch.
Make the Next Step Clear on Every Page
Each page should have one main action that is easy to see, also on mobile. The button text should say what happens, for example "Get a Quote for a Site Visit" instead of "Submit". The phone number should be tappable everywhere.
Build Trust Where Doubt Appears
Reviews, known customers and guarantees work best close to the button, not at the bottom of the page. In an online store, that means a clear return policy and familiar payment options. For a service business, it means photos of real jobs and the name of the person the customer will meet.
Write for the Person Who Decides
Many websites describe the company, not the problem the customer wants solved. Start with what the customer gets, what it costs and how fast it happens. The article on website design shows how to build a page that sells.
Online Stores: Checkout Is Where the Money Leaks
Baymard Institute asked online shoppers in the US why they abandoned a purchase. The numbers below apply to those who actually intended to buy, not those who were just browsing.
| Reason for abandoning the purchase | Share |
|---|---|
| Extra costs such as shipping and fees were too high | 40 percent |
| Delivery was too slow | 20 percent |
| Did not trust the site with credit card information | 19 percent |
| Had to create an account | 18 percent |
| Checkout was too long or complicated | 17 percent |
| Errors or crashes on the website | 17 percent |
| Poor return policy | 13 percent |
| Could not see the total cost early enough | 12 percent |
Several of the reasons are about surprises. Show shipping early, let customers buy without an account and offer the payment options they know, such as PayPal, Apple Pay or Shop Pay. Baymard estimates that most checkouts could have 20 to 60 percent fewer elements than they have today.
Example: VuggeBaby
VuggeBaby sells baby products with embroidered names. The checkout had many fields, mixed two languages and did not show how far along the customer was. Customers also had to guess what the embroidery would look like.
We added a preview of the name on the product page and rebuilt the checkout with three clear steps and text in one language. The nearest pickup point is now chosen automatically. We also set up server-side tracking, so every sale is recorded correctly in the ad channels.
From March to May 2026, revenue rose by 108 percent and the number of purchases by 132 percent, compared with the same period the year before. The result comes from several measures together, including ads and email, not from the checkout alone. Read the full VuggeBaby case study.
Service Businesses: The Form and the Phone
For a plumber, an accounting firm or a lawyer, the conversion is an inquiry. Then the phone and the form must work without errors on mobile. Track taps on the phone number and email address as separate events, or you only see part of the result.
Many inquiries also start outside the website. Taps on "Call" in your Google profile are not recorded in GA4. Follow them in the insights for your Google Business Profile, and look at them together with the numbers from the website.
Also make it easy to choose how to get in touch. Some want to call, others prefer to write. A short form, a visible phone number and a chat cover most people.
The Tracking Trap: Consent and Cookies
In the EU and EEA, analytics tools such as GA4 and Clarity normally need consent before they can set cookies, and it must be as easy to say no as to say yes. Privacy laws in several US states also give visitors the right to opt out of some tracking.
That means you do not see all visitors in your analytics. Your conversion rate can change without customers changing their behavior. Be careful when you compare periods before and after the consent banner was changed.
The solution is not to make the banner hard to decline, because that is not allowed. Use Google Consent Mode instead, which lets Google estimate what is missing. Also count what you have regardless, such as orders in the online store and inquiries in the inbox.
Conversion Rate Optimization, SEO and Google Ads Work Together
SEO and ads decide how many people come. The conversion rate decides what the visits are worth. A website that converts well makes every click cheaper and every ranking in Google more profitable.
Google Ads also gets better when conversions are tracked correctly. Automated bid strategies learn from conversion data, and without it, the system bids on the wrong searches. The guide Google Ads for beginners shows how to set up tracking.
Many of the same changes also help SEO. Fast loading, a clear structure and answers to the questions customers have are what both Google and AI search look for. The article on SEO-friendly websites explains the connection.
Get Started This Week
You need neither a budget nor testing tools to take the first steps. Set aside a few hours and do this in order.
- Send the form and complete a purchase on your phone yourself, and note everything that annoys you.
- Check that every conversion is recorded in GA4 and in your ad account.
- Find the step with the biggest drop-off in the funnel.
- Watch 20 recordings of sessions that did not end in a conversion.
- Fix the biggest obstacle, and note the date of the change.
If the website itself is in the way, we build websites where conversion is planned from the first sketch. We track every form, every phone tap and every purchase from day one.
Frequently Asked Questions
What does CRO mean?
CRO stands for conversion rate optimization. It means getting a larger share of your visitors to buy, get in touch or take another action you want. The work is about the traffic you already have, not about getting more.
What is a good conversion rate?
It depends on the industry and the type of page. Unbounce found around 6.6 percent across 41,000 landing pages, while online stores are lower. The best benchmark is your own progress over time, measured on the same channel and device.
How do I calculate my conversion rate?
Divide the number of conversions by the number of sessions and multiply by 100. If 4,000 sessions give 60 inquiries, the conversion rate is 1.5 percent. Use the same definition every month, so the numbers can be compared.
Do I need A/B testing?
Only if you have a lot of traffic. With a 2 percent conversion rate, you need around 42,000 visits to detect a 20 percent improvement. If you have less than that, you get more out of fixing clear problems and measuring before and after.
Which tools do I need?
GA4 shows where people drop off, and Microsoft Clarity shows recordings and heatmaps for free. You also need your customers' own words from email, phone and chat. Remember that analytics tools need consent under EU privacy rules.
How much does conversion rate optimization cost?
You can do a lot yourself with free tools. If you hire an agency, you usually pay an hourly rate, often around 90 to 200 USD. Larger changes to checkout or forms are often priced as a separate development project.
What is the difference between CRO and UX?
UX, or user experience, is about the website being easy and pleasant to use. CRO is about more people taking the action the business needs. The two overlap a lot, but CRO is always measured in conversions.